
Research Park Venn Diagram
Research Park Venn Diagram
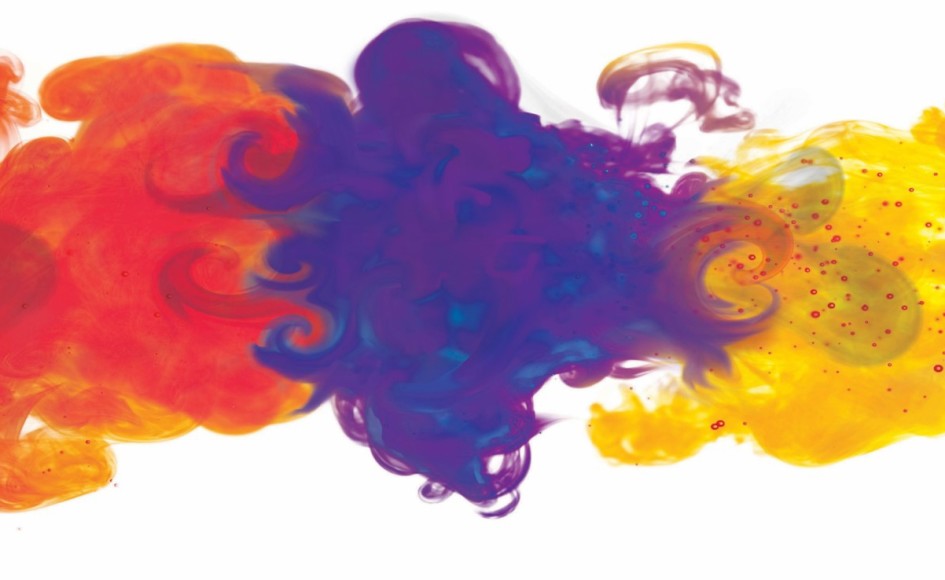
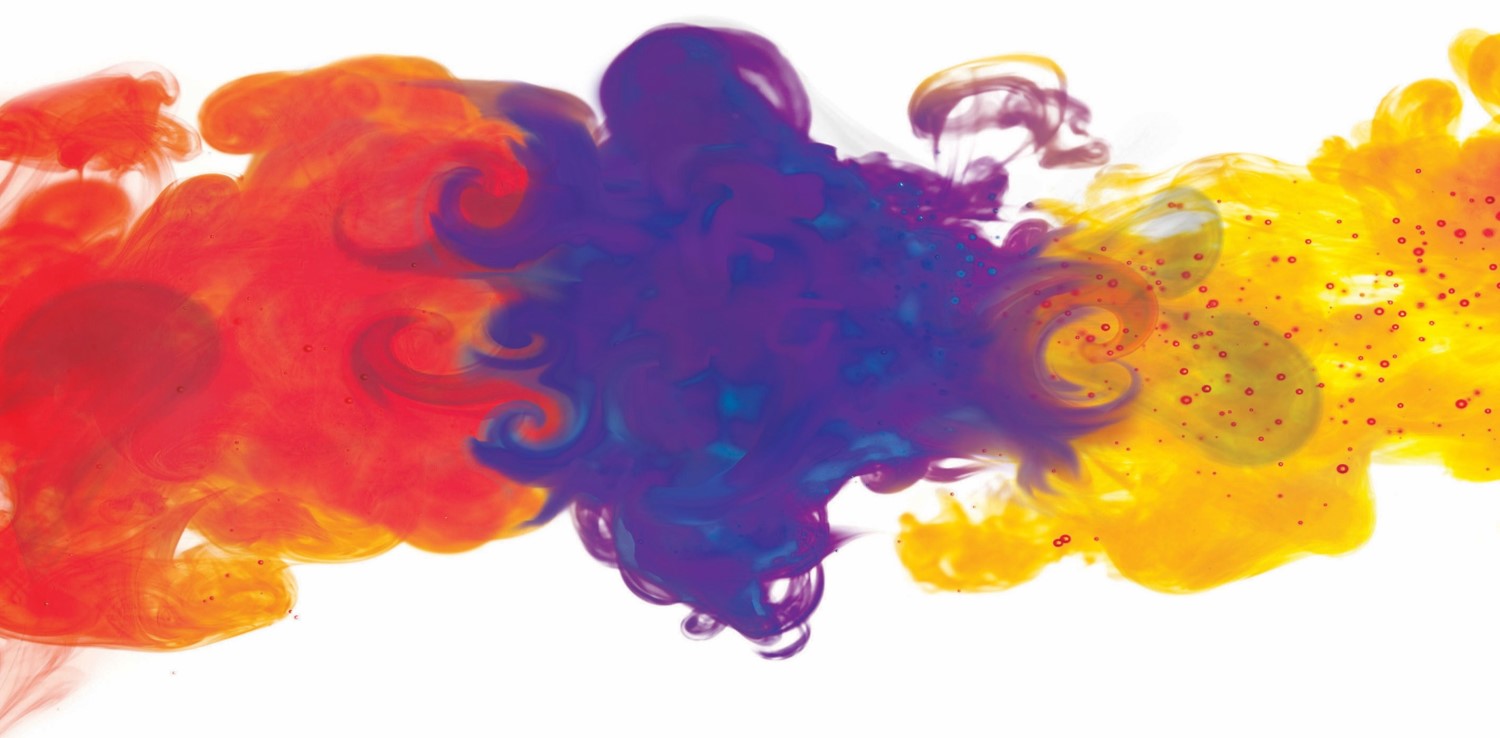
After searching for new ways to express my approach to operations and how I envisioned the interactions between business development, marketing, communications, real estate and programming at the Research Triangle Park I stumbled upon this beautiful yet simple image. I found it inspiring because it conveys what I believe to be the most realistic visual representation of how the interplay and overlap of ideas actually interact.
Typical venn diagrams are often overly simplified with perfect circles and clean areas of intersection. In reality it is the exact opposite! Convergence is often organic and fluid… there is an interplay between the ideas (red), the people (blue), and places (yellow). I have found that the magic happen at the beautifully blended intersections… the oranges and purples! That is where I want to operate, experiment, and explore!
1 Comment